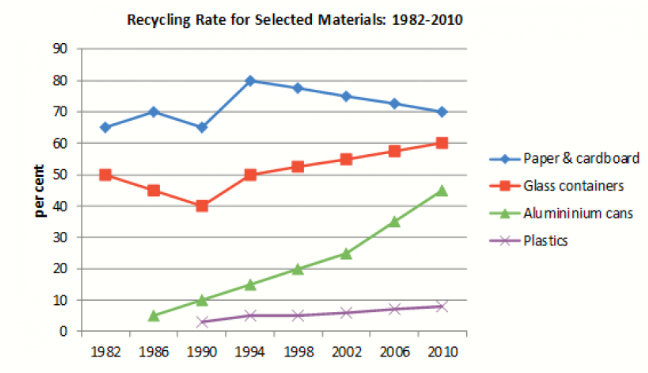
The line graph illustrate the percentage of four different materials were recycled namely: Paper and card board, Glass containers, Aluminum cans and Plastics over 28 years period.
Overall, There was a rise in the percentage of recycled in all types of materials, with Aluminum seeing the most dramatic increase. In addition, Paper and cardboard was by far the most material was recycled.
In the first 8 years, Paper and cardboard fluctuated at the same site, with 65%, following by Glass containers, which witnessed a decrease to 40% in 1990. Additionally, despite witnessing an increase, Aluminum remained at the third rank, with 10%. Plastics commenced the period with around 3% in 1990.
In the next 20 years, Paper and cardboard saw a dramatical rise to 80% before gradually decrease to 70% in 2010 and stay at the highest figures. Glass containers rose to 60% over a 20-year period and remained as the second most popular site. Similarly, but to a greater extent, Aluminum saw its figures rose significantly to around 45%. Finally, despite witnessing a rise to 9%, Plastics remained the least figures.


 Đăng ký

Bạn cần đăng nhập để them gia bình luận