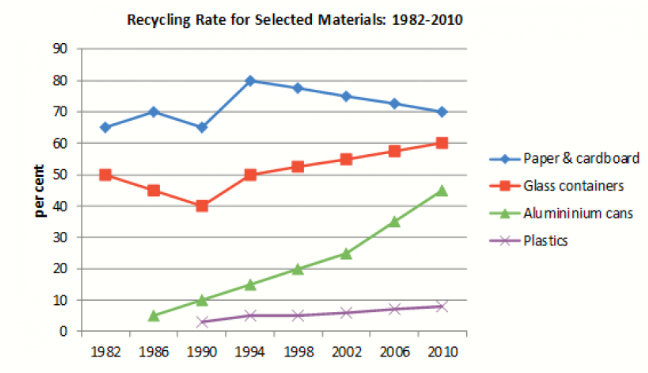
The line graph depicts the share of recycling selected materials, categorised by paper and cardboard, glass containers, aluminium cans and plastics from 1982 to 2010.
From an overall view, what stands out from this graph is that the figures for plastics remained stability, while these for paper and cardboard displayed a dramatic fluctuations. Glass containers and aluminium cans exhibited an increasing trajectory in recycling rate.
In 1982, only two materials applied in recycling, including paper and cardboard, standing at 65% and glass containers, about 50%. The turn from 1982 to 1994 witnessed significant changes, with recycling aluminium cans and plastics’ appearance, reaching 15% and 5%, respectively. Inspite of oscillation, the information about glass containers remained the same point with that in 1982, whereas, paper and cardboard gained 80%, increaseing by 15% compared to that in 1982.
From 1994 to 2010, the data about paper and cardboard rose marginally, acounted for 10% and achieved the minority. Conversely, these about aluminium cans followed an significantly upward trend, reached its peak of 45%, increasing by 30%. The rate of recycling paper and cardboard glass decreased by 10% to 70%, still took the lead in this graph. In contrast to paper and cardboard, glass containers, the percentage of recycling glass containers rose by 10%, gained 60%.


 Đăng ký

Bạn cần đăng nhập để them gia bình luận