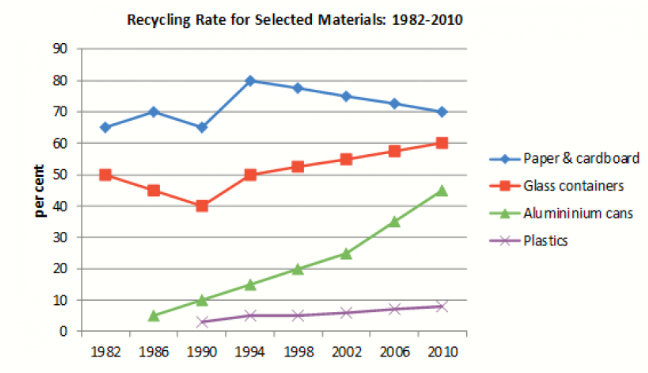
The line graph details the percentage of four various materials that were recycled between 1982 and 2010 in a particular country
Overall, there was decreased in the proportion of Paper and cardboard, while a reverse pattern could be seen in the percentage of glass containers, alumininium cans and plastics, with the proportion of used alumininium cans rising the most significantly. Addtionally, the proportion of paper and cardboard was invariably highest and plastics was invariably lowest.
In 1982, the percentage of paper and cardboard started around 62%, followed by glass containers, at 50%. In 1990, the proportion of the former and the latter were declined sharply, at about 61% and 40%, respectively. However, from 1990 to 2010, the proportion of glass containers began growth sharply, and rached a peak at 60% in 2010. While the percentage of paper and cardboard incrased slightly and rached at around 80% in 1994, from 1994 to 2010, this material began declined sharply and hit a low at 70%.
In 1986, the proportion of alumininium ans strated at about 2%, anf the percentage of plastics was commenced 1%. while the percentage of aluminium cans began increased sharply and reached a peak at 42% in 2010. The percentage of plastics increased slightly and reached at 9% in 2010


 Đăng ký

Bạn cần đăng nhập để them gia bình luận