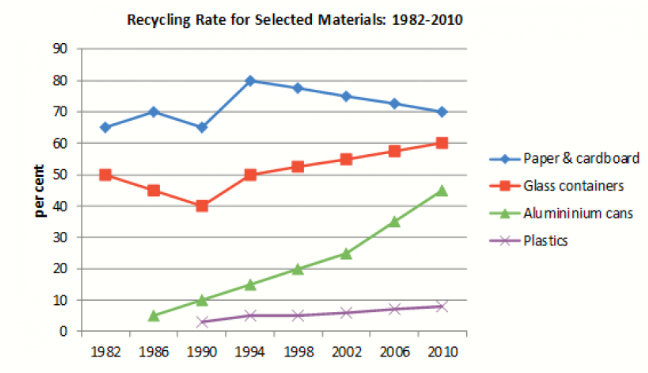
The line chart illustrates the percentage and compares four different materials recycled in 28 consecutive years, starting from 1982.
As is observed, Paper & cardboard was the highest percentage in all years, followed by Glass containers. While Aluminum cans were rated until 1986 with a low percentage, and Plastics were not evaluated until 1990.
On the one hand, Paper & cardboard have a fluctuating proportion, with almost 60% at the lowest point and 80% at the highest point. Moreover, glass containers had an average percentage with a drop from 1982 to 1990, reaching 40% and a gradual rise from 1990 to 2010, reaching 60%.
On the other hand, Aluminium cans dramatically increase from 1986 to 2010 and reach more than 40%. Last but not least is Plastics, this materials were not evaluated until 1990 and had a slightly rising with almost 10% at the last years.
To sum up, Paper & cardboard and glass containers had the high percentage in Recycling Rate for Selected Materials, aluminium cans and plastics had a low percentage.


 Đăng ký

Bạn cần đăng nhập để them gia bình luận