


 Đăng ký
[qag aegh]
Writing Practice Test 16965
Task 1
Question 
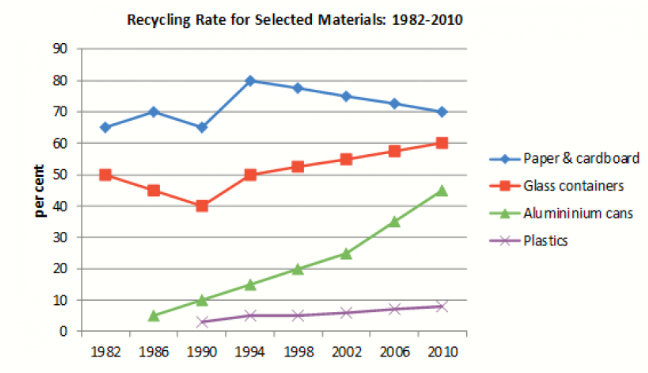
The graph below shows the proportion of four different materials that were recycled from 1982 to 2010 in a particular country.
Summarise the information by selecting and reporting the main features, and make comparisons where relevant.
Write at least 150 words.
Answer
Task 2
Question
Answer
Share & get evaluation from community
Bạn cần đăng nhập để them gia bình luận