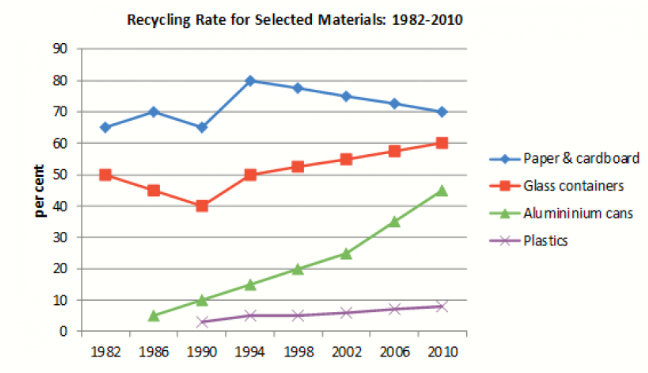
The line graph illustrates the percentage of four materials—paper and cardboard, glass containers, aluminum cans, and plastics—that were recycled between 1982 and 2010 in one specific country.
Overall, it can be clearly seen that the recycling rates for all selected materials followed an upward trend, albeit at varying rates of increase.
Regarding the proportion of paper and cardboard, although there was a minor dip in 1990, the figure leveled off and gradually declined, yet still remained in the first position. Similarly, around 60% of the glass containers were recycled at the end of the surveyed period, accounting for the second-highest percentage.
In terms of gradual increases, aluminum cans and plastics both showed similar traits. However, while the figure for aluminum cans increased significantly to around 45% compared to the original figure, the recycling rate of plastics only showed a slight increase, with 5% more than the original proportion.


 Đăng ký

Bạn cần đăng nhập để them gia bình luận