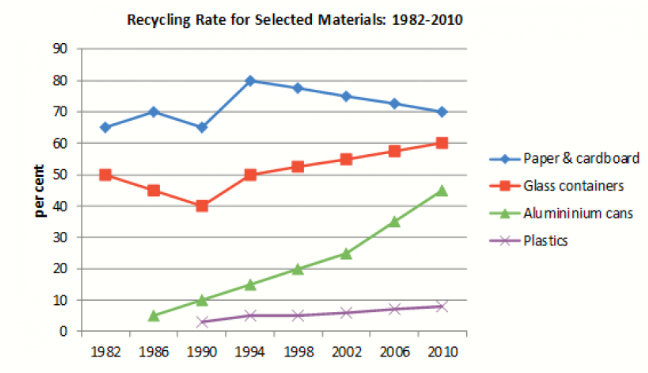
The line graph illustrates the percentage of various material recycled between 1982 and 2010 in a specific nation.
Overall, the recycling rate for all chosen materials witnessed upward trends. Additionally, the figure for recycled paper and cardboard and glass containers were always higher compared to the others throughout the period survey.
Regarding the proportion of recycled paper and cardboard and glass containers, in the beginning of the period, the data for these sectors were 65% and 50% respectively. The recycling rate for the former observed a fluctuation then turning to the initial point while the latter one decreased to 40% in 1990. In 1994, the percentage of these categories increased dramatically to 80% and 50% in that order before the former’s proportion plunged while the latter’s figure witnessed an increasing trend in the remaining years. Eventually, 70% of recycled paper and cardboard and 60% of glass containers were recycled in 2010
In terms of the remaining sectors, in 1986 , the recycling rate for alumininium cans were around 5% the its data had the most drastic upward trend in the next years and end up at 45% in 2010 . In 1990, the percentage of plastics were recycled were 3% after that its proportion increased slightly to roughly 9% in the end of the period.


 Đăng ký

Bạn cần đăng nhập để them gia bình luận