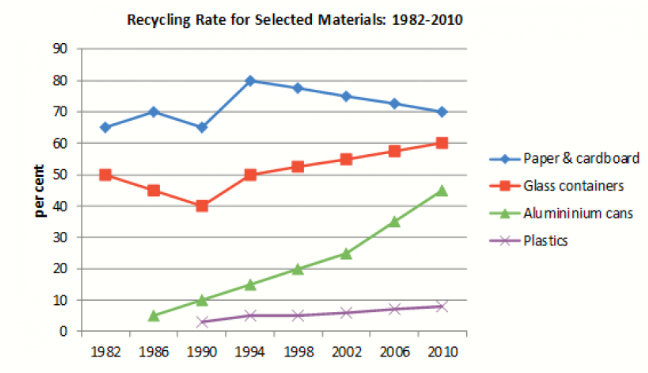
The given diagram provides information about four distinct recycled substances in terms of percentages between 1982 and 2010 in a certain country.
Overvall, it can be observed from the graph that paper and cardboard was the most commonly recycled group while the opposite is true for plastics. Additionally, the recycling trends of all four types of materials experienced an upward trend to varying degree through out the given period.
As can be seen from the graph, in the starting year, among the two most frequently recycled materials types given, paper and cardboard’s rate of reprocessing was the superior with a disparity of about 15 percent compared to its runner-up. In the next four years the time frame, the rate of recycling for paper and cardboard and that of glass containers shared a similar fluctuating pattern until 1994, when they increased to 80 percent and reverted to 40 percent respectively. From this time onwards, the patterns of the two figures diverged significantly, with products made from paper and cardboard experiencing a decreasing rate of recycling while glassware items underwent an opposite trend. By the end of the period, the rate of recycled paper and cardboard goods was 70 percent which was 10 percent higher than that of containers made of glass.
In terms of alumininium canisters and plastics, the process of recycling for these two categories of materials were only recorded from 1986 and 1990 respectively. These two latecomers displayed an upward trend and it can be observed that alumininium-made containers were recycled at a significant higher rate than synthetic-polymer based goods. In 2010, the reprocessing rates of cans made from alumininium rosed from less than 10 percent to around 45 percent; that of plastic merchandises rose minimally, remaining just under 10 percent.


 Đăng ký

Bài này mình viết còn sạn ngữ pháp và chính tả, có gì mình xin góp ý về word choice với mạch ý nha