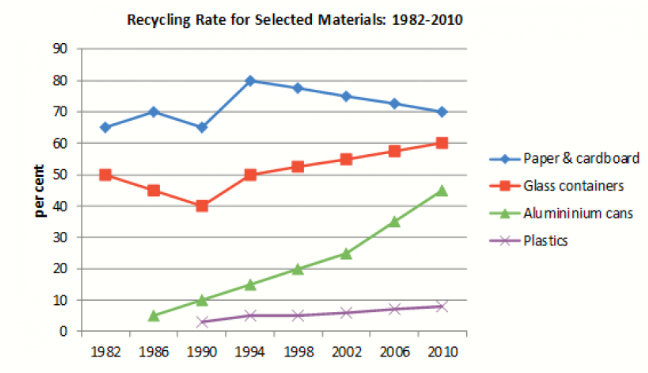
The line graph illustrates the proportion of four distinct materials recycled in a particular country between 1982 and 2010.
Overall, among the materials depicted, paper and cardboard emerged as the most recycled, while plastics consistently ranked as the least recycled. Notably, the recycling rate of aluminium cans demonstrated significant growth, contrasting with a relatively stable trend for glass containers.
In 1982, the recycling rates for the materials varied significantly. Paper and cardboard started at approximately 20%, while glass containers held a considerably higher rate of 55%. In stark contrast, aluminium cans had a minimal recycling rate of around 5%, and plastics were hardly recycled, with figures close to 0%. Over the years, paper and cardboard exhibited a continuous upward trend, culminating in a recycling rate of about 75% by 2010, despite a minor decline between 1990 and 1994. Concurrently, the recycling rate for aluminium cans surged dramatically, reaching 70% in 2010, thereby surpassing the rates for glass containers, which fluctuated and ultimately decreased to 50% after a high of 55% in the early years.
Conversely, the recycling of plastics, which began to gain traction in 1986, progressed at a slower pace, culminating in approximately 20% by 2010, reflecting a gradual increase over the study period. The trend for glass containers was marked by slight fluctuations throughout, with a modest increase from 55% in 1982 to 60% in 2010. Despite these shifts, glass containers maintained a relatively stable recycling percentage, whereas paper and cardboard solidified their position as the predominant recycled material, achieving significant growth in contrast to the other items.


 Đăng ký

Bạn cần đăng nhập để them gia bình luận