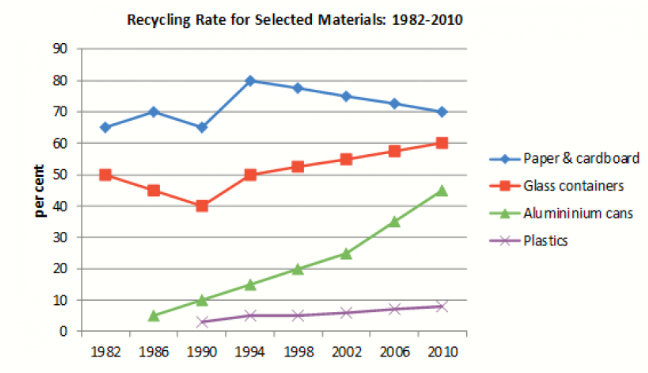
The line chart has shown the Recycling trend of listed Materials divided into four categories including Paper and Cardboard; Glass containers, Aluminum cans and Plastic during the 28-year period from 1982 to 2010. It is easily to be seen Paper got the highest rank of recycling percentage while Plastics was not significantly put into attention.
Having a grasp at the given chart, we can witness a fluctuation in Paper & Carboard and Glass containers recycling level. Paper & Cardboard made up higher total percent ranging from 65% in 1982 to 80% in 1994 and steadily decreased to 70% until 2010. The second highest percent place belonged to Glass containers even though it experienced a slight slump from 50% in 1982 to 40% in 1990 and continuously grew to 60% at the end of period. On the other hand, among the two remaining Materials, Aluminum cans showed a dramatic rise from 5% to 45% only within 15 years and Plastics gradually received more attention by growing from 2% to 9% in the recycling rate 1990-2010.
In conclusion, the amount of plastics might not be recycled increasing fast enough in compared with the rest. This could be considered as an opportunity to foster more significant plans to improved recycling rate of this favored material.


 Đăng ký

Bạn cần đăng nhập để them gia bình luận