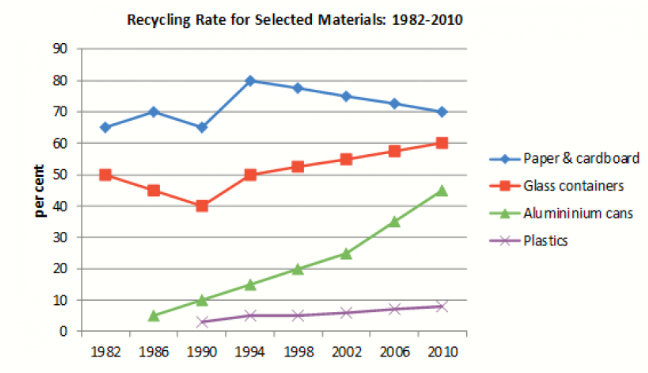
The given line graph compare the percentage of four various material were recycled between 1982 and 2010 in a particular country
Looking at the chart ,it can be seen clearly that the proportion of paper and cardboard material were the highest whereas the percentage of plastics material were the lowes ones
The proportion of paper and cardboard materials remained relatively stable during the examined period. In 1982 ,the proportion of paper and cardboard materials that were recycled stood at nearly 70% . over the next four year , this data increased and made up 70 percent. However ,in 1990 , the proportion of paper and cardboard materials that were recycled decreased and reached at nearly 70 percent .over the next four years ,this data suddenly went up and reached at 80 percent .During the remaining years ,this fingure witnessed a gradual downward and made up 70 percent in 200.
The proportion of glass containers materials that were recycled also remained relatively changed during the examined years . From 1982 to 1990 ,this data decreased between 50 percent and 40 percent . during the remaining years ,thí data witnessed a upward trend . Finally ,about the percentage of aluminium cán and plastics materials ,this data were also increased .


 Đăng ký

Bạn cần đăng nhập để them gia bình luận