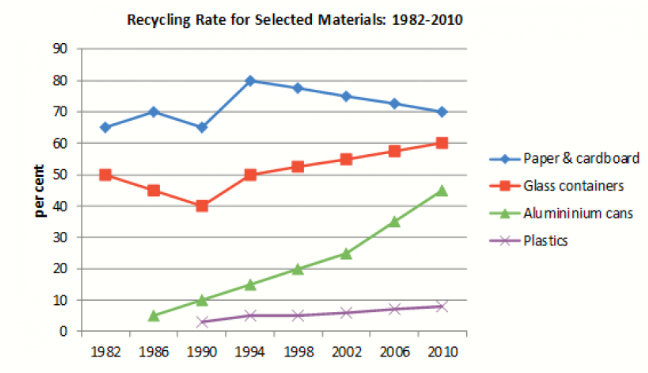
The given line graph illustrates the percentage of recycling distinctive items during the period 1982 to 2010. Overall, alumininium cans and plastics that had a later starting point. Besides, glass containers, paper & cardboard and alumininium cans witnessed a significant upward trend while plastics grow gradually.
On the one hand, alumininium cans and plastics whose figure appeared in 1986 and 1990 respectively. Additionally, there was a remarkable increase in the recycling rate for alumininium cans, from approximately 5% to 45%. In contrast, plastics highlighted a tendency to grow gradually and stood at roughly 10% in 2010.
On the other hand, paper & cardboard witnessed a fluctuation before its figure alleviated slightly throughout the period and accounted for 70% in 2010. The figure of glass containers had a opposite trend compared to paper & cardboard. Moreover, having decreased considerably until 1990 from 50% to 40%, glass containers accelerated noticeably between 1990 and 2010 to 60%.


 Đăng ký

Bạn cần đăng nhập để them gia bình luận