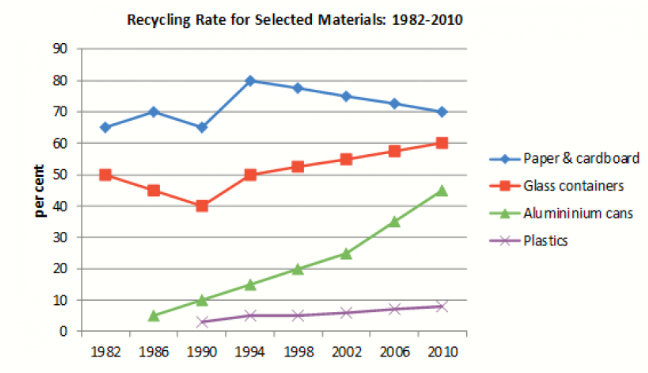
The line chart illustrates how many percentages of four different materials underwent the recycle process between 1982 and 2010 in a country.
Overall, although the recycling rate of all materials experienced a rise, the figure for paper & carboard and glass container fluctuated during the period, while that of aluminum cans and plastics witnessed a constant change.
At the beginning, there was 50 percents of glass containers which was recycled in 1982. From that point to 1990, it witnessed a slight reduce in the level of recycled materials to 40 percents and then grew back again to 50% in 1994. Afterwards, the rate of glass containers recycled consistently increased and reach the peak of 60% in 2010, making it the second rank.
Otherwise, roughly 65% of paper & clipboard was recycled in 1982, which was the highest rate of recycled material. The figure then fluctuated between 70% and 65% in the next 2 ensuing years. Following that, the proportion of recycled paper & clipboard rose to the highest point of 80% in 1994 before starting to decline consistently to 70% in the rest of the period. However, paper & clipboard was always the highest recycled-rate materials.
In contrast, the figure for recycled aluminum cans witnessed a constant growth from approximately 5% in 1986 to roughly 45% in 2010. At the same time, the rate of recycled plastics experienced the same trend, from roughly 4% to almost 10%.


 Đăng ký

Bạn cần đăng nhập để them gia bình luận