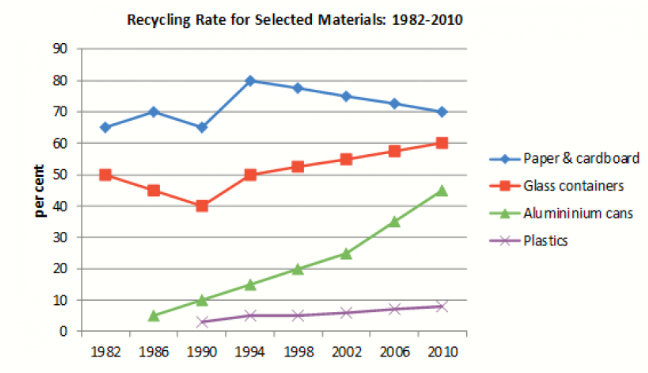
The graph illustrates the percentage of the recycling in four different materials from 1982 to 2010 in some specific countries.
Overall, It could be seen clearly that paper & carboard accounted for the largest proportion of total materials from over the given years , and the flowing was Glass containers , Alluminium cans experienced a significant increase over the years while the opposite was true for Plastics.
In 1990, paper & cardboard and Glass containers fall considerably, in 1994 both of these increase ,while glass containers went up rapidly from1994 to 2010, paper & cardboard witnessed a gradually dropped from 1994 to 2010. Although there was fluctuations over the given years , paper & cardboard still accounted for the largest proportion
While there was a dramatic increase in Allumininium cans in the over given years the opposite was true for Plastic which did not change substantial over the period


 Đăng ký

Bạn cần đăng nhập để them gia bình luận