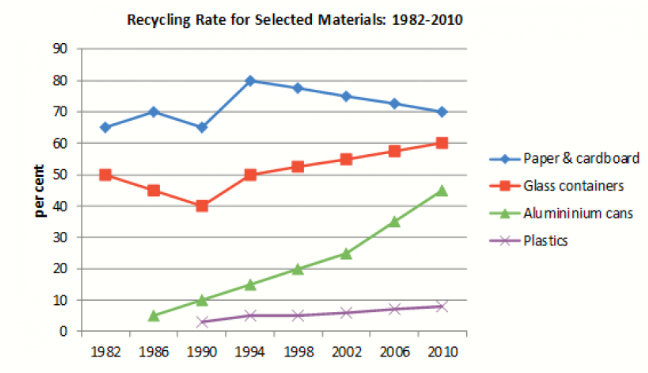
The line graph illustrates the percentage of four different recycled materials in a country between 1982 and 2010.
Overall, the most recycled material were paper and cardboard. While the plastics was the least recycled material among other materials over the period of 28-year.
In 1982, there was an unsteady trend in the figure for paper and cardboard which started at about 65% before it fluctuated dramatically in 1986 and 1990 at 70% and 65% respectively. In 1994, the figure rose up to 80% and then decreased slowly down to 70% the following years. After this trend, the proportion for glass containers stood at 50% in 1982 and dropped down to 40% in 1990 before grew gradually to 60% after the 28 years of a period.
In the same period, the figure for Aluminium cans started from below 10% in 1986 and then witnessed a significant growth to about 45% took place in 1994. While that for plastics was the lowest in the graph with only about 1% from the start in 1982 to a slight rise to almost 10% in the next 28 years.


 Đăng ký

Bạn cần đăng nhập để them gia bình luận