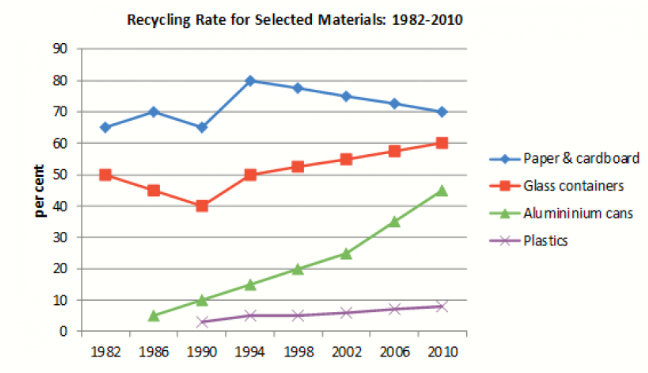
The line graph illustrates the percentage of four materials – paper & cardboard, glass containers, aluminium cans, and plastics – that were recycled in a particular country between 1982 and 2010.
Overall, recycling rates for all materials showed an upward trend over the period, although the extent and pace of growth varied. Paper and cardboard consistently had the highest recycling rates, while plastics remained the least recycled material.
In 1982, around 65% of paper and cardboard were recycled, making it the most recycled material. This figure rose to a peak of about 80% in 1994, before gradually declining to approximately 70% by 2010. Glass container recycling started at around 50%, experienced a slight drop in the mid-1980s, but steadily increased to reach just above 60% by the end of the period.
Recycling of aluminium cans began later, around 1986, at approximately 10%, but showed a steady and significant increase to around 45% by 2010. In contrast, plastics had the lowest recycling rate throughout the period. Starting from around 1990, their rate rose slowly from about 5% to roughly 10% in 2010.
In conclusion, although all materials saw improvements in recycling over time, there was a notable gap between the recycling rates of different materials, with paper and cardboard leading and plastics lagging behind.


 Đăng ký

Bạn cần đăng nhập để them gia bình luận