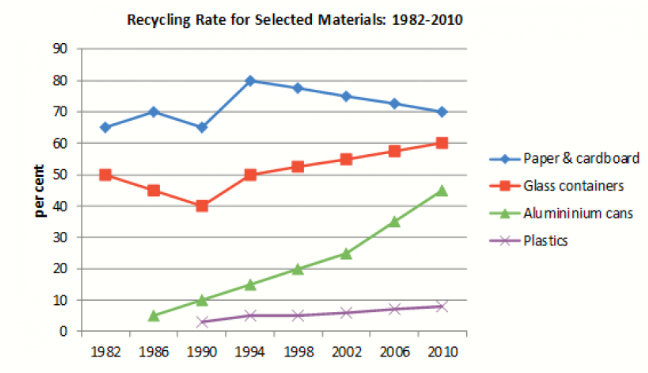
The line graph illustrates the recycling rate for four different materials, namely paper and cardboard, glass containers, aluminium cans, and plastics, from 1982 to 2010 in a selected nation.
Overall, what stands out from the graph is that all figures climbed but to different extents. While paper and cardboard and glass containers underwent fluctuations in their data, the other materials witnessed a more consistent increase. It is obvious that paper and cardboard recorded that highest percentage of recycling throughout the period, while alumininium cans possessed the most remarkable growth in figure.
Regarding those experiencing fluctuations, data of paper and cardboard fluctuated around 65% in the first 8 years before reaching the peak of 80% in 1994, subsequently fell gradually to 70% in the end, remaining the highest group among the four materials. On the other hand, starting at 50%, the figure for glass containers decreased to 40% in 1990 prior to its recovery in the other 20 years and stood at 60% in 2010.
With a more stable increase rate, alumininium cans rose dramatically from under 10% to almost 50% between 1986 and 2010. Additionally, first appearing in 1990, plastics reported a slight increase in its figure, remaining under 10%.


 Đăng ký

Bạn cần đăng nhập để them gia bình luận