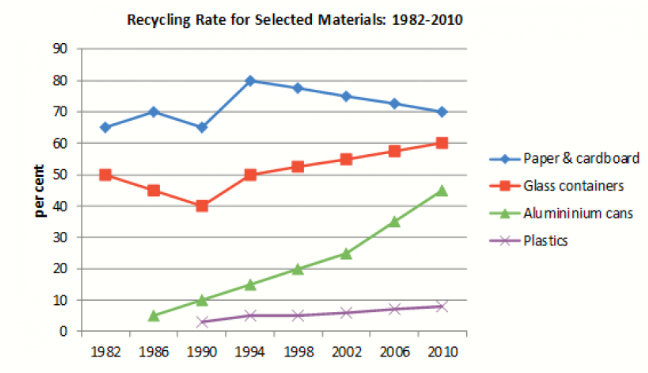
The line chart provides a detailed overview of the proportion of four different materials that were recycled in a particular country from 1982 to 2010.
Overall, the paper/cardboard reuse rate was the highest among the selected materials for the first period and slightly decreased by the end of the given period. Conversely, aluminium cans were initially in the lowest position, but then steadily rose in percentage. Glass containers and plastics remained stable throughout the given period.
In terms of paper/cardboard recycling, it started at approximately 65% in 1982, and fluctuated until it gradually dropped to 60% in 2010. Similarly, the glass containers’ rate began at 50% in reused material, and dramatically fell to 40% in 1990, but then it steadily rose to 50% in 2010. And the aluminium cans’ rate witnessed the opposite inclination when it was first introduced at 5% in 1986, and increased to approximately 45% in 2010. Lastly, the plastics still maintained the rate until 2010.


 Đăng ký

Bạn cần đăng nhập để them gia bình luận