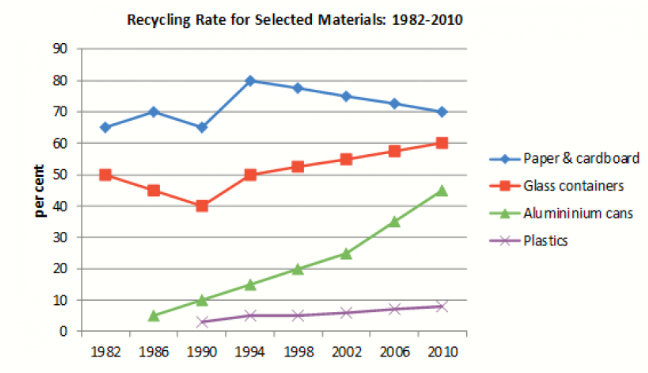
The line chart illustrates the percentage of recycling four different materials in a particular country between 1982 and 2010.
Overall, four different categories. were recycle, experienced a upward trend. Furthermore, recycling paper and cardboard experienced the primary rate over the period, while the figure for plastics witnessed reserve trend.
Regarding the two different categories, the proportion of paper and cardboard had a fluctuation around 65% over the first 8 years. Subsequently, it recorded a remarkable improvement at 80% in 1994, prior to hitting a lower of gradually around 70% over the years. Meanwhile, recycling the plastics represented the lowest initially at approximately 3%. Despite a moderate rise to roughly 8%, it remained the smallest part.
Concerning the other materials, glass containers started a half in 1982, dropped to 40% in 1990, and then showed a consistent rise, reaching 60% by 2010. In contrast, aluminium cans were not recycled in significant amounts until 1986, after which the rate dramatically climbed from about 10% to approximately 45% in 2010.


 Đăng ký

Bạn cần đăng nhập để them gia bình luận