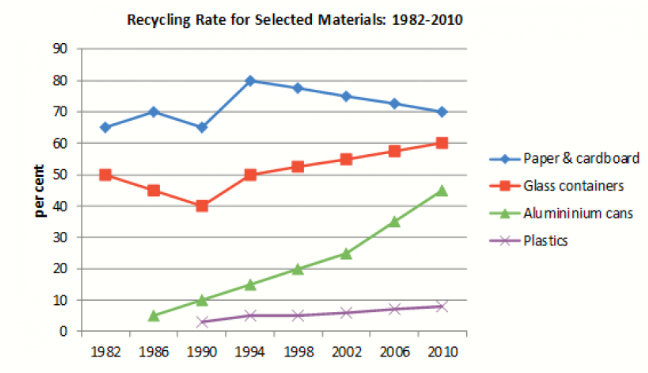
Contained in the given line graph is data pertaining to the percentage of four dissimilar recycled materials between 1982 and 2010 in particular nation.
Overall,it can be observed that the proportion of four recycled materials experienced upward trend throughout the period.Addtionally,paper & cardboard was the most recycled materials at first and also be the largest number of recycling by the end of the entire duration.
Regarding the top 2 most recycled materials ,both of which rose lightly during 28 years.In terms of paper & cardboard ,its percentage fluctuacted between nearly 70 and 65 from 1982 to 1990 and reached peak of 80 in 1994 ,finally decreased moderately to about 70 by the end.Likewise,glass containers began with 50 in 1982 then had a dip of 40 ,ultimately, its proportion recoveried to 60 in 2010.
Turning the focus towards the two remaining materials,the percent of them also climbed by the end.Look in the aluminium cans figure,its percent started with approximately 5 in 1986 then increased noticeably to about 45 in 2010.In the meantime,the proportion of plastics was nearly 4 in 1990 finally gradually increased to approximately 9 by the of entire duration


 Đăng ký

Bạn cần đăng nhập để them gia bình luận