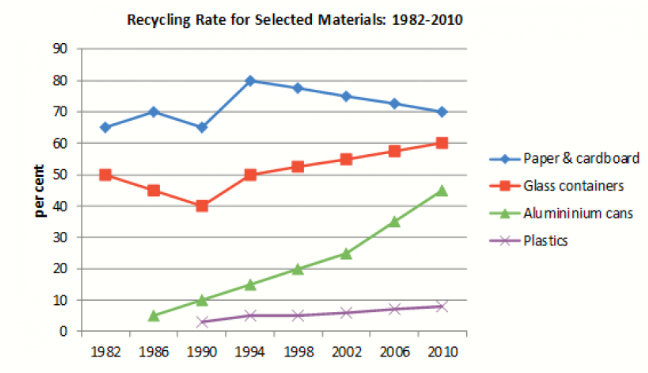
The given line graph depicts the percentage of four types of materials that underwent the recycling process from 1982 to 2010, including paper and cardboard, glass, aluminum, and plastics. Overall, despite some fluctuations, each material witnessed an upward trend, with aluminum cans being recycled the most.
According to the graph, in 1986, the aluminum cans recycling rate sat nearly at the bottom and constantly climbed to 25 percent in 2002. It did not stop and jump to 45 percent 8 years later. Similarly, another figure that did not fluctuate dramatically was the recycling proportion of plastics. Although it rose slightly in the 1990-2010 period, it seemed as if the figure stayed the same.
The remainders were the two that varied relatively greatly. Both saw a deep trough in 1986 but sprung back in 1994. However, after which, while the glass containers recycling rate increased until 2010, that of paper and cardboard went down consistently.


 Đăng ký

Bạn cần đăng nhập để them gia bình luận