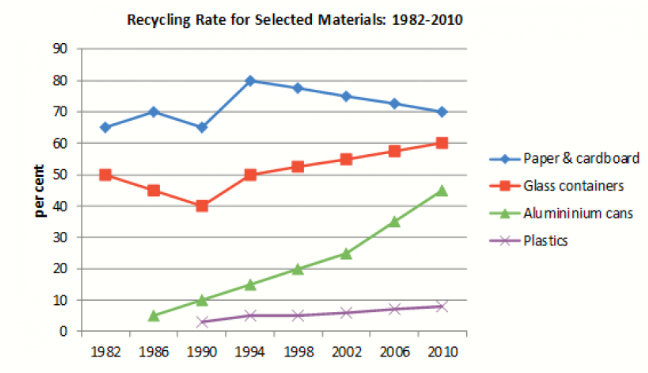
The line graphs compare four different materials which were recycled between the years 1982 and 2010 in a directly country.
It is clear that there were significant changes of materials that were recycled over the period shown. Overall, a much larger percentage of Paper&cardboard and Aluminium cans had strongly increased recycling through the years.
In 1982, the propotion of Paper& cardboard and Glass containers had been started recycling with 65% and 50% reaching the graph. Between 1986 and 1990, another material which called Aluminium cans had also been began recycling gradually. Until the year of 1990 , the plastics had just been appeared and grown slowly.
By 2010, the number of Paper& cardboard was to reach 70% and the number of Glass containers were also growing up after the Paper& cardboard. Besides,


 Đăng ký

Bạn cần đăng nhập để them gia bình luận