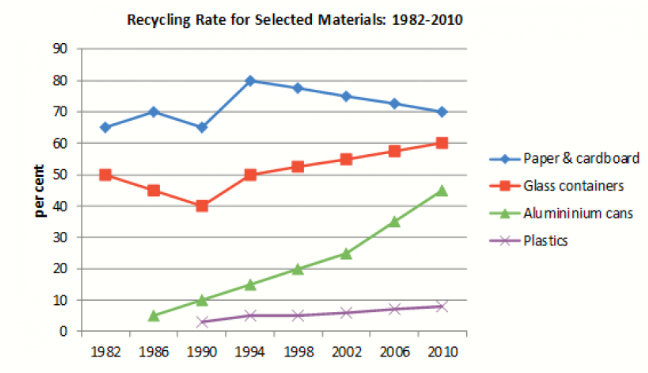
What you can see in the graph is 4 colored fluctuated line joining many points by line segments. They represent for the recycling rate of paper, cardboard, glass containers, aluminic can, and plastics from 1982 to 2010.
The light blue one is the graph of the paper and cardboard recycling rate. Starting from around 65% in 1982, it increased to 70% in 1986 and then go to the highest point as 80% in 1994. That the biggest percentage of recycling not only in paper & cardboard case but also in the four material we are talking about. Then, sadly, the number gradually decreased to 70% up to 2010.
The second graph, in red color, is the recycling rate of glass containers. Starting at 50% in 1982, it moved downward to 45% in 1986 and to the lowest point as 40% in 1990. It only took 4 years for that number to grow 10% to 50% but 16 years later to 60%. So the rate is rather slow but it still climbs up.
The green graph of aluminum can is the steepest graph. The recycling rate from approximately 5% in 1986, moving up 10% in 1990 and kept up moving at the same rate 5% per 4 years up to 2002. Then it accelerated in the first 10 years of 21th century from 25% to 45% in 2010. The rate had changed from 5% to 10% per 4 years. That’s good news for us and one of the reason may be the versatile of aluminum.
The last but most important graph is the graph of recycling plastics. Plastics has been wonderful since the day it had been discovered. It’s useful, versatile and tough so that it appeared anywhere in our lives, and that’s why we overuse them. Also, because of the toughness, we don’t know how to break or remove them. They last buried in the ground or float around in the ocean. That explains the rate of recycling plastics from 1990 to 2010, in 20 years almost a horizontal line with little variation from 2% to appoximately 9%.


 Đăng ký

Bạn cần đăng nhập để them gia bình luận