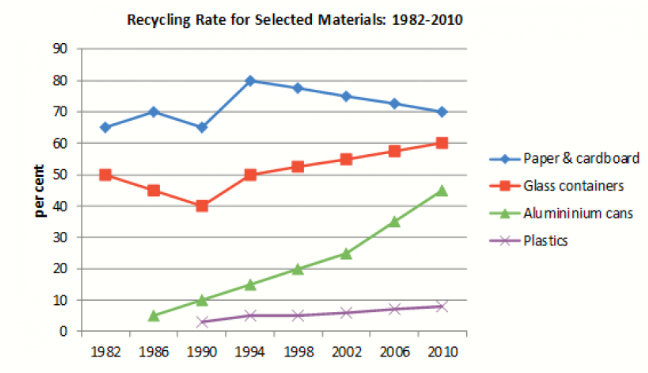
This line graph illustrates the percentage of four different materials that were recycled for 28 years, iniating from 1982 in a particular country.
Overall, the amount of recycled products of these materials virtually rose but there were a slightly reduction.
For glas containers, aluminium cans and plastics, they were all increased. Started being recycled in 1982, glass containers plunged 10 percent in 1990 then went up nonstop until 2010. Sharing the same characteristic with glass containers, both aluminium cans and plastics grew significantly and no interrupted fall in the middle.
With paper and cardboard, the recyling rate had many changes. It began with 65 percent then reach 70 percent in 1984-1985. After that the rate lessened as the starting percentage. Then it rocketed dramatically to 80 percent until it had sign to fell relentlessly to 2010.
In conclusion, the proportion of four different materials that were recycled from 1982 to 2010 in a particular country has huge changes in it


 Đăng ký

Bạn cần đăng nhập để them gia bình luận