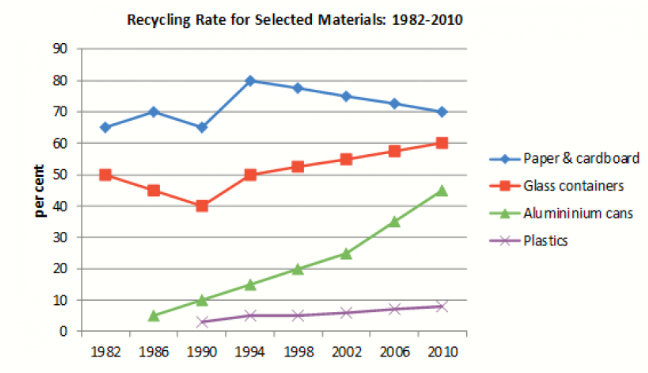
Looking at the graph, We can see the difference of recycling rate for 4 different materials from 1982 to 210 in a particular country, follow to the ordinal number for the biggest proportion to the smallest proportion corresponding to the different materials: paper & cardboard, glass containers, alumininium cans and plastics. In 1982, plastics and alumininium cans had no percent, glass containers was 50%, paper & cardboard was over 60% and under 70%. In 1986, plastics still had no percent, alumininium cans was under 10%, glass containers was under 50% and over 40%, paper & cardboard was 70%. From 1990 to 2010, plastics was always under 10% althought it increased a bit. From 1990 to 2010, alumininium cans improved a lot of proportion, from 10%, over 10%, 20%, over 20%, over 30% to over 40%. While glass containers decreased in 1990 with 40% and increased from 1994 to 2010, from 50% to 60%. Paper & cardboard decreased in 1990 with under 70%, increased in 1994 with 80% but kept on decreasing from 1994 to 2010, fro. 80% to 70%. Generally, paper & cardboard developed much, glass containers was stable, alumininium cans was potential and plastics was quite new, undeveloped.


 Đăng ký

Bạn cần đăng nhập để them gia bình luận