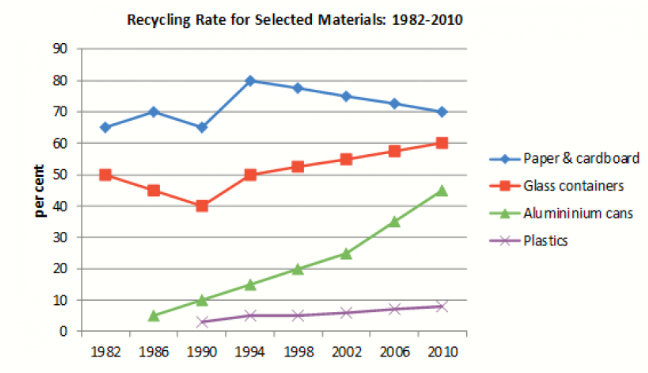
The given line graph gives information about the percentage of four different recycling materials, namely paper and cardboard, glass containers, aluminum cans and plastics during a 28-year period, starting from 1982.
Overall, it can be seen that, the amount of recycling rate for materials saw an upward trend over the period shown. Moreover, the figure for paper and cardboard was the highest.
The year 1982 saw a fluctuation and then made a considerable growth to 70 percent in 2010. next, Glass containers made a slight fall accounting for 40 percent after 8 years and from 1990, it increased gradually by 60 percent in 2010.
A rose dramatically was seen in the alluminium cans recycled in 2010 accounting of approximately 40 percent. Finally is plastics with a bit climed taking up under 10 percent through 20 years.


 Đăng ký

Bạn cần đăng nhập để them gia bình luận